When you monitor an Osprey nest using OspreyWatch, you’re helping so much more than just that one family. Your contribution will help every Osprey in the world, far into the future.
Make your passion for Osprey count.
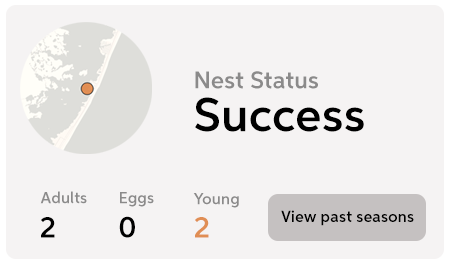
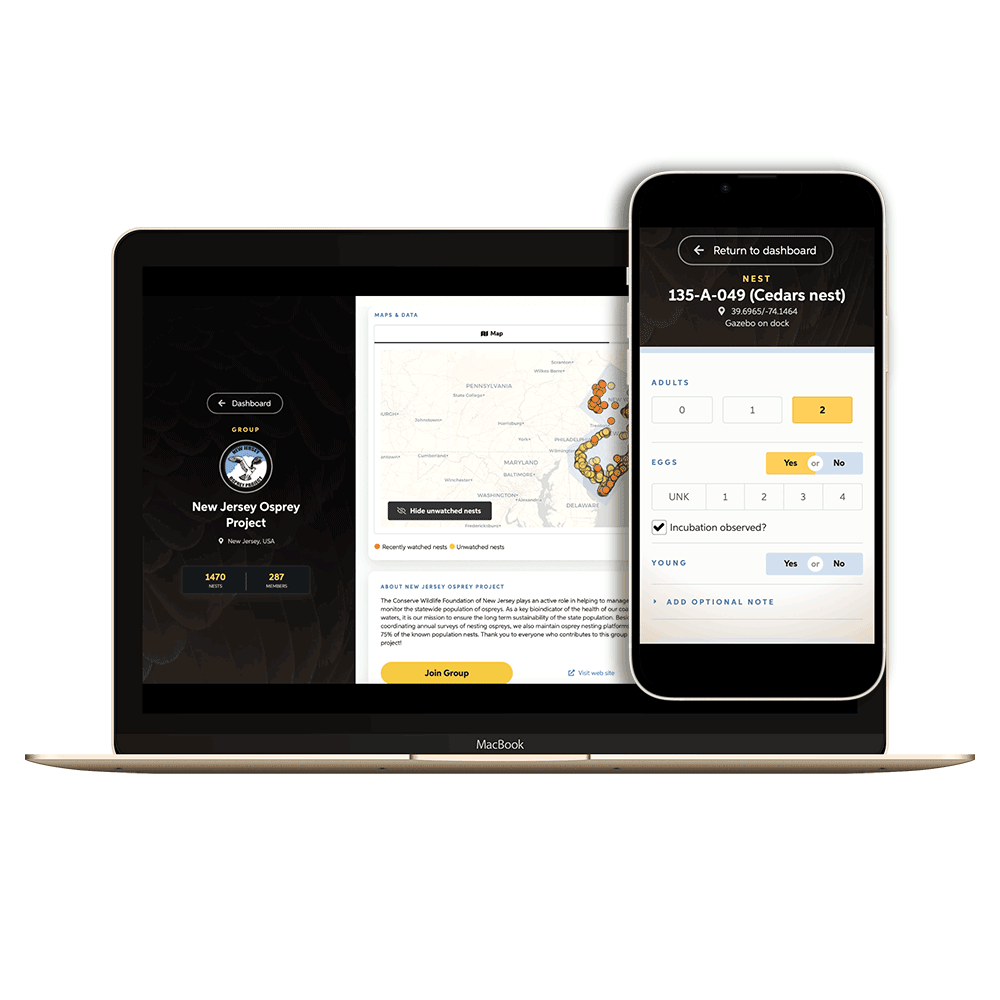
Contribute observations from your favorite Osprey nests and help Osprey all over the world!


OspreyWatch is powered by enthusiasts from 249 countries across the world.
Become an OspreyWatcher today and start contributing photos, notes, and observations.
1,289
Nests
6,899
Nest Watchers
9,876
Nest Checks
Multiply the value of every observation
Why We’re Watching
Don't have the time, or a nest to monitor? There are other ways to contribute.
We appreciate all of the partners and sponsors who make this effort possible. Please help support the dedicated individuals who maintain the project.
Learn more about this magnificent species, or even build your own Osprey Platform using our resources.